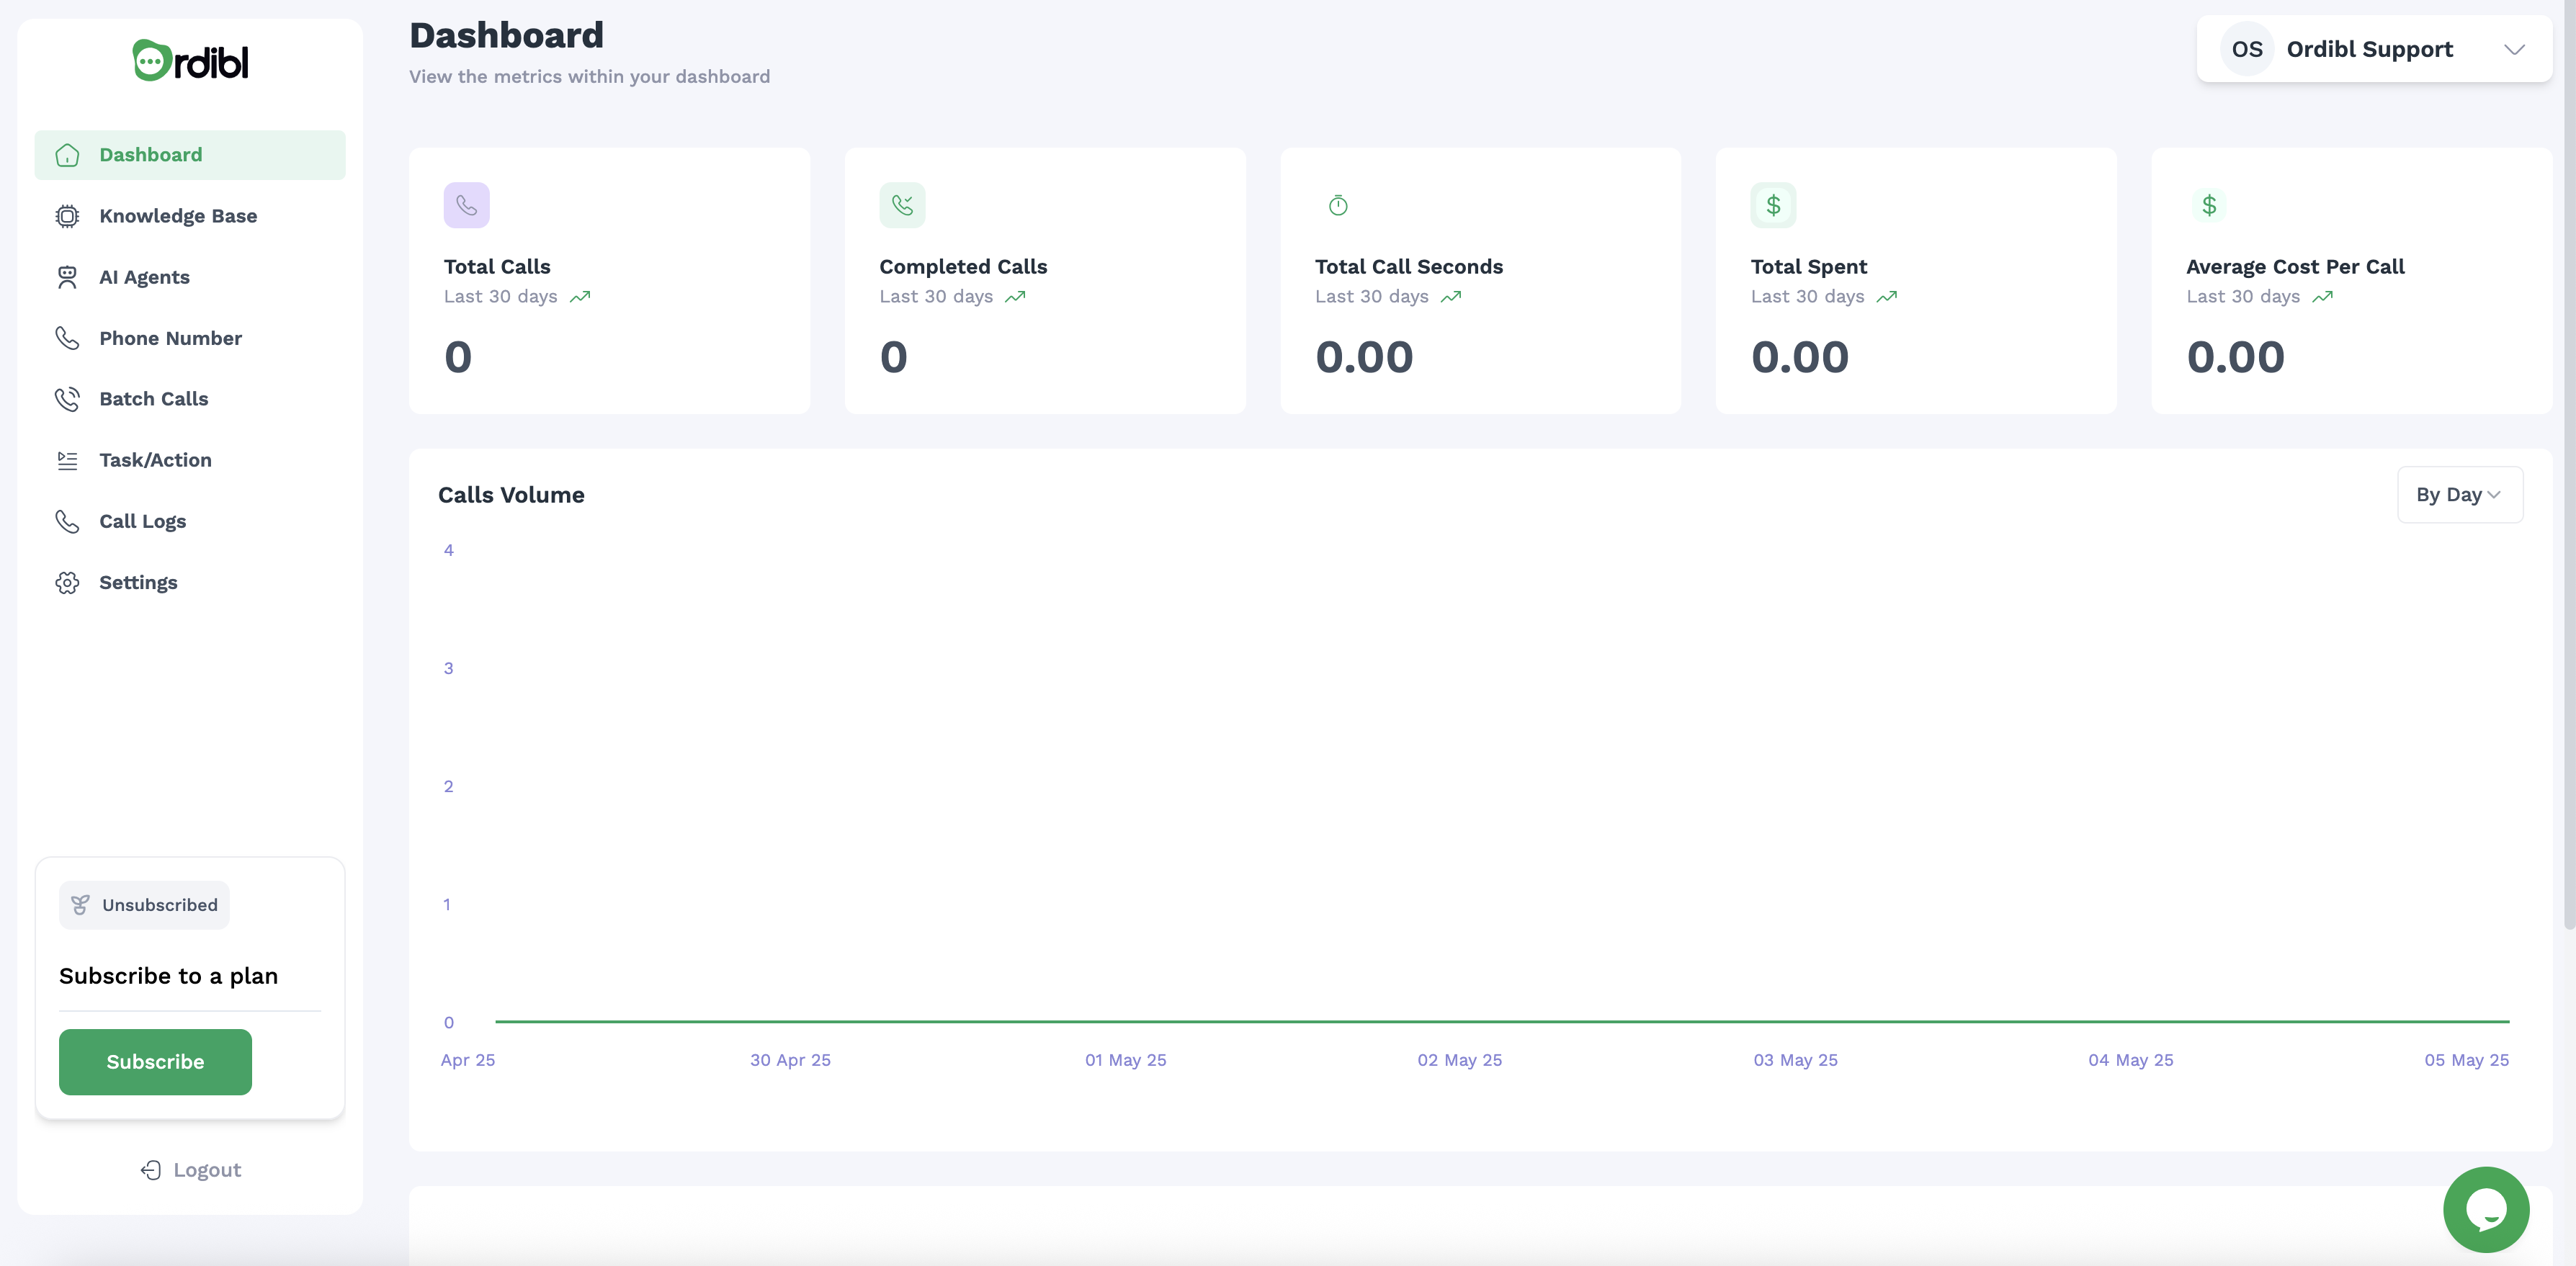
Accessing Your Dashboard
- Log in to your Ordibl account
- You’ll automatically land on the Dashboard page
- If you’re in another section, click on “Dashboard” in the left navigation panel
Dashboard Overview
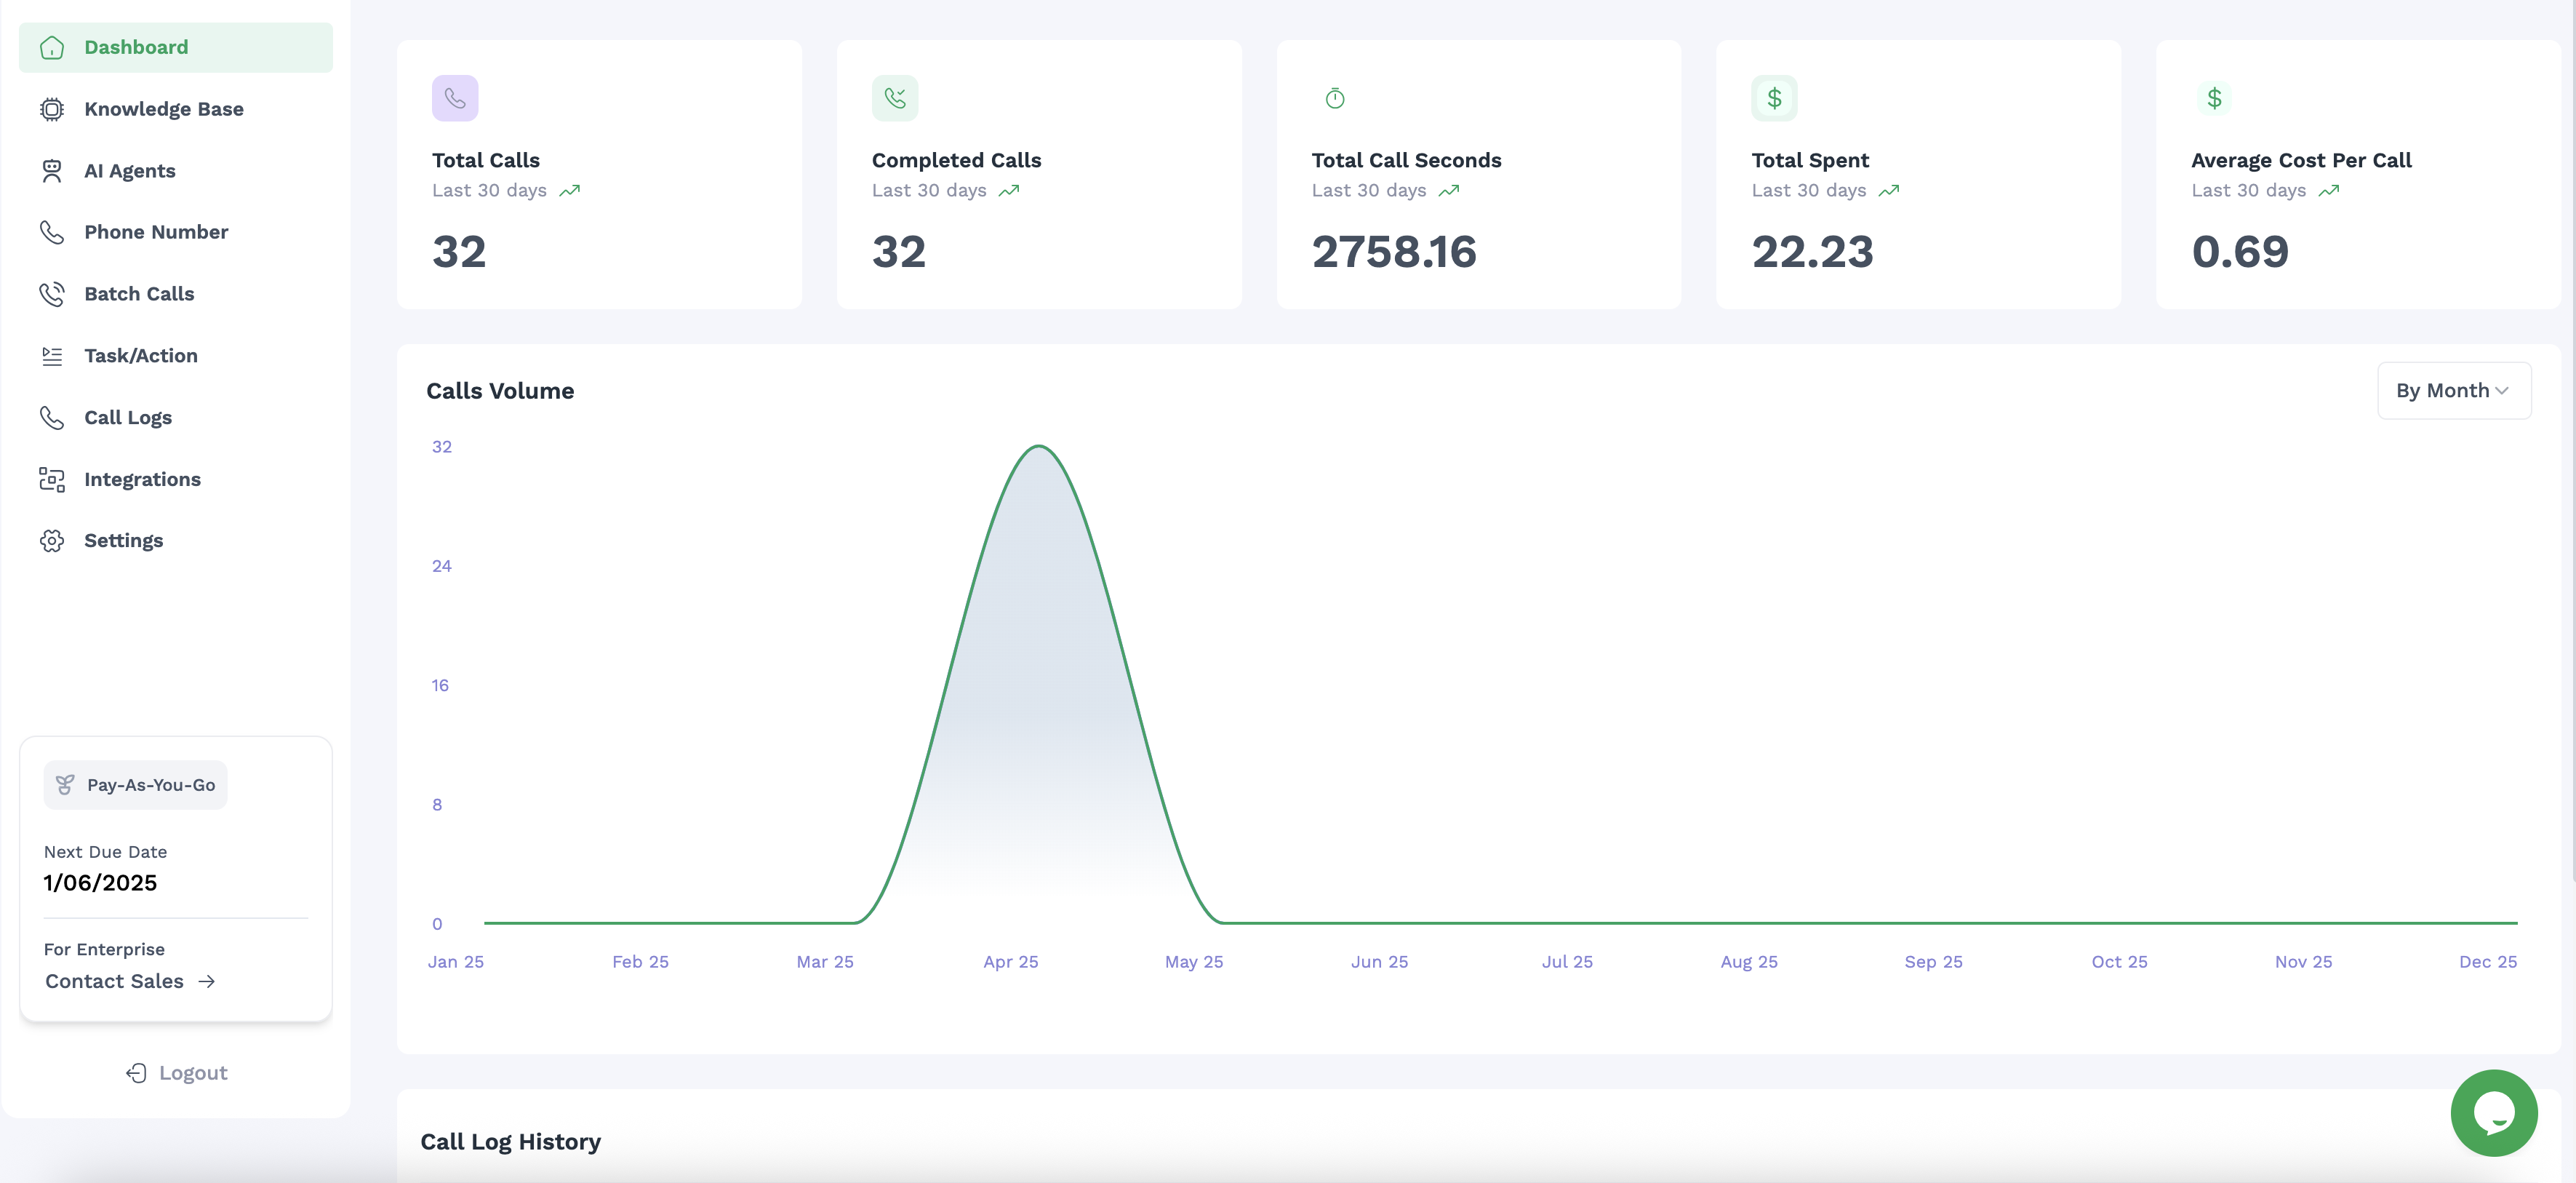
Your Ordibl Dashboard is designed to provide a clear snapshot of your AI calling performance with key metrics and visualizations.Key Performance Metrics (Top Section)
The dashboard displays five essential metrics for the last 30 days:- Total Calls: The number of all calls made or received (32 in the example)
- Completed Calls: Successfully connected and finished calls (32 in the example)
- Total Call Seconds: Cumulative duration of all calls (2758.16 seconds in the example)
- Total Spent: Your total expenditure on calls ($22.23 in the example)
- Average Cost Per Call: The mean cost per call ($0.69 in the example)
- Current value
- “Last 30 days” timeframe indicator
- Trend indicator showing increase/decrease
Call Volume Graph (Middle Section)
The interactive call volume graph shows:- Call distribution over time
- Y-axis showing number of calls (0-32 in the example)
- X-axis showing months (Jan-Dec)
- A bell curve showing call concentration (peaked in April-May in the example)
- Time period filter option (“By Month” dropdown in the top right)
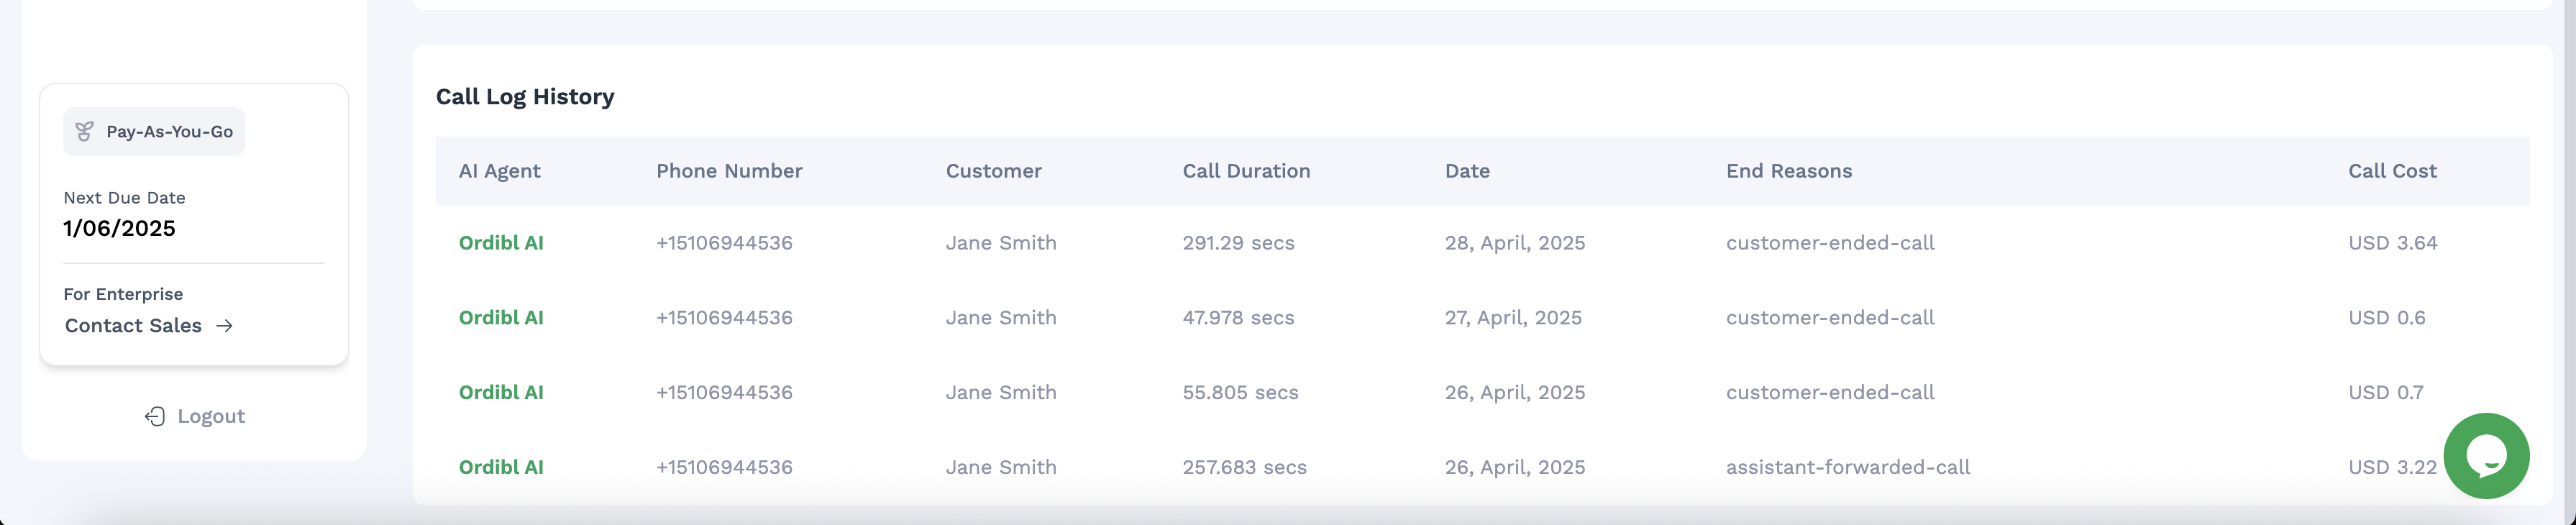
Call Log History (Bottom Section)
The detailed call history table includes:- AI Agent: The name of the AI agent that handled the call
- Phone Number: The contact’s phone number
- Customer: Customer name or identifier
- Call Duration: Length of each call in seconds
- Date: When the call occurred
- End Reasons: How the call concluded (customer-ended, assistant-forwarded)
- Call Cost: Individual cost for each call in USD
Navigation Menu (Left Sidebar)
The left sidebar provides access to all major sections:- Dashboard: Overview of call performance and metrics (current page)
- Knowledge Base: Manage information sources for your AI
- AI Agents: Configure and manage your AI agents
- Phone Number: Manage your phone numbers
- Batch Calls: Schedule and manage bulk calling campaigns
- Task/Action: Configure tasks for your AI agents
- Call Logs: Detailed records of all calls
- Integrations: Connect with CRM and other systems
- Settings: Configure your account and preferences
- User Profile: Manage your account settings and preferences
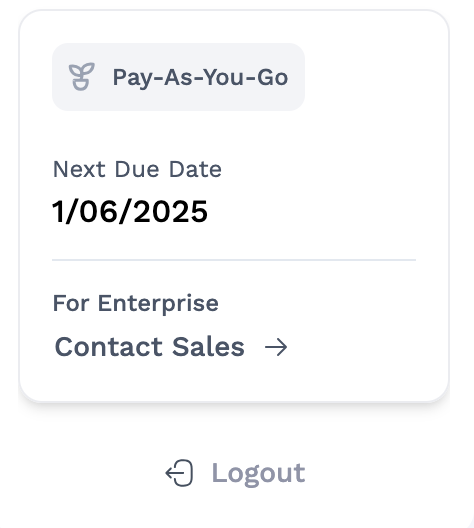
Account Information (Bottom Left)
The bottom left section displays:- Pay-As-You-Go: Your current billing plan
- Next Due Date: Your next billing date (1/06/2025)
- For Enterprise: Contact Sales link for upgrading
- Logout: Option to sign out
Live Support
A chat bubble icon appears in the bottom right corner, providing instant access to support.Using Dashboard Data Effectively
- Use dashboard insights to determine when to add or adjust AI agents
- Plan knowledge base updates based on call performance
Best Practices
- Check your dashboard regularly to spot trends early
- Use insights to refine your AI conversation flows
- Compare performance across different time periods
- Review specific call logs for quality assurance